Machine Learning Algorithm for Data Classification
| ✓ Paper Type: Free Assignment | ✓ Study Level: University / Undergraduate |
| ✓ Wordcount: 1842 words | ✓ Published: 25 Oct 2021 |
The Purpose of this report is demonstration of selection, implementation and evaluation of a machine learning algorithm to classify three categories of Hazelnut mentioned in dataset. This report covers all the basic points about how this is achieved:
- Design decision
- Algorithm
- Test and Result
- Conclusion
Design decision
We are going to achieve this classification in Python using Jupyter notebook. Main reason behind selecting this language is Python’s simple syntax and readability which makes it easy to read by any user and as well as perform testing. Also, as mentioned in assignment one, this language is chosen to enhance knowledge of ML with Python.
The base design chosen to complete this task is decision tree. Basis of building classifier in this algorithm is ID3 with some modifications. As the name signifies, it’s a tree like structure constituting a parent node i.e. root which sub-divided into successive children (branches and then finally leaf). This tree is built by splitting the source data.
Basically, decision tree is creation is divided into two major steps:
1. Induction – This is the main stage where we build our tree where we set hierarchical boundaries. First, we investigate our dataset and decide to follow a classification or regression approach. Second, determine a feature on which you want to split your dataset. One can find all the splits then determine best split among them. Third, split your data into such a way that it contains possible values for the best feature. This determines the node for the tree. Fourth step is where we recursively follow this approach until a point of optimization is reached.
2. Pruning – It is the step where we decrease the complexity by removing unnecessary structure from tree. It helps in reducing the chances of overfitting.
There are some pros of using decision tree:
Main advantage is it’s very easy to understand as decision tree works in very logical way. If we explain in layman terms then, you can say that if a condition is satisfied, then a node will be created as YES branch otherwise as NO branch. No programming logic or concept is required to understand a prototype of decision tree.
It requires very less data pre processing as compared to other Machine learning algorithms which use many normalization schemes.
Even though our dataset is small, but decision tree is great to work with in case of heavy dataset.
Although one needs to keep a check on overfitting in decision tree.
Algorithm
For running the attached code in appendices, one should have jupyter notebook installed on his machine. Also, dataset should be saved, and path of csv should be modified according to user’s local directory. Below are the steps which will be easy for user to understand the whole code/algorithm (code indentation is done as well):

Section1: It comprises all the needed python libraries needed to build this algorithm.
Section 2: Data set has been converted into a csv format which is usually a predefined acceptable format worldwide and loaded data as dataframe. All the preprocessing has been done in this section which includes renaming the columns, dropping of unwanted column and converting column type into int datatype.
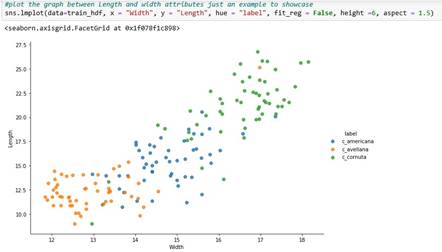
Section 3: Data set has been divided into training and testing dataset. Training dataset (2/3) is used to build the classifier in algorithm while testing dataset(1/3) is used to test. A graph is also included to demonstrate two features of three different labels in the dataset.
Section 4: This section comprises classification of data (which variety appears most often and has largest number in data) and all potential splits for our decision tree based on which root will be decided.
Section 5: Calculation of Entropy happens in this section. According to basic definition Entropy is measure of randomness in the information being processed. In ML we generally calculate entropy to determine homogeneity of sample (partitioning of sample into subsets that has similar values).
Section 6: Find the best splits among all the splits which were found in section 4 based on their entropy.
Section 7: This section contains our classifier where we are defining how much depth our tree should have, root should be chosen based on best split, and branch out the tree. This section also gives an overview how the tree looks like.
Section 8: Here we are classifying all the samples and sub dividing into leaves and appending them with node.
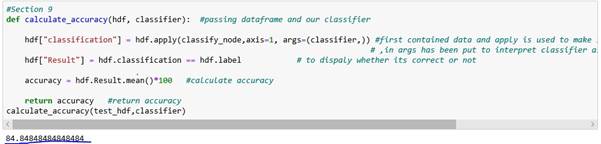
Section 9: Calculation of accuracy is happening in this section along with display of test data which gives an overview of which predicted label is correct against its actual label.
Section 10: Trying to implement K fold cross validation.
Algorithm has been commented thoroughly so that If any user who has basic knowledge of python will be able to understand it.
Test and Result
A Graph has been plotted to showcase the difference between three labels of Variety Hazelnut based on two features.
After running the algorithm and it has reported an accuracy of approximately 84.84%
An error has been detected while running 10-fold cross validation (in random) which is Python specific function. So, at present 10-fold validation is not working. So as a workaround If we run this code 10 times with different random divisions of dataset as an input to classifier then we are getting an accuracy of 87.2%
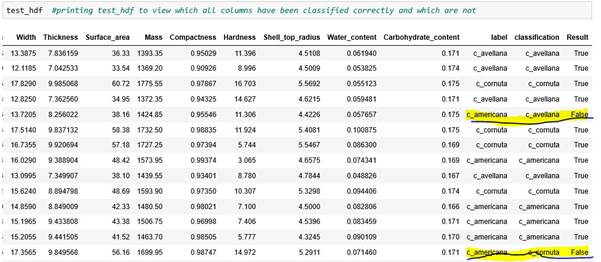
A test report also been generated to view what all predicted labels has resulted as True/False as compared to actual label.
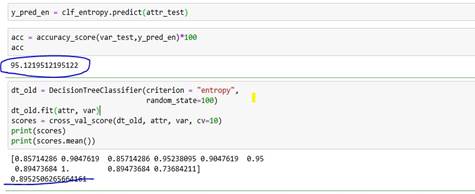
While when same Classifier has run with the help of scikit package, an accuracy of 95.12% has been reported with 89.52% as result of 10-fold cross validation.
Conclusion
In Decision Tree classifier is just like a flowchart diagram with parent nodes representing classification decisions. We are taking ID3 our base which does not guarantee optimal solution and after implementation of Decision tree from scratch on Hazelnut dataset it’s been confirmed that in approximately 84% of cases this model is predicting right variety of Hazelnut based on other features associated with it.
On the other hand, decision tree with the help of scikit package gives an approx. 95% accuracy which is more than without use of package. Though we are choosing lowest entropy for determining best feature, but it may be an indication that if we have used information gain or weighted decision tree while implementation then it could have given more accurate result. Though both algorithms gave same kind of result (marginal difference of 2%) on 10-fold cross validation.
Appendix
Final code for decision tree
Code: #Section 1 import pandas as pd #Importing all the basic libraries which are needed import numpy as np
#import matplotlib.pyplot as plt import seaborn as sns #This library is used to generate graph
import random #Section 2 hdf = pd.read_csv(r’C:\Users\dell\Desktop\ML\Hazelnuts.csv’) #reading the dataset file
hdf = hdf.transpose() #transpose of dataset
hdf.columns =
[‘Sample_id’,’Length’,’Width’,’Thickness’,’Surface_area’,’Mass’,’Compactness’,’Hardness’,’Shell_top_r adius’,’Water_content’,’Carbohydrate_content’,’Variety’] hdf.reset_index(inplace=True) #reset the index 1,2,3,4….. to first column from dataset hdf=hdf.drop(‘index’,axis=1) #drop index values hdf=hdf.drop(‘Sample_id’,axis=1) #drop sample id as its of no use while predicting hdf = hdf.rename(columns={“Variety”: “label”}) #rename the variety to label as it is meaningful to give this name on which classification will happen for col in hdf.columns[:-1]: # Iterate over chosen columns hdf[col] = pd.to_numeric(hdf[col]) #convert column into numeric as columns were string type
#Section 3 def train_test_size(hdf,test_size):
if isinstance(test_size, float): #function to take a test size test_size = round(test_size*len(hdf))
indices = hdf.index.tolist() #to covert into list so it can be fed into random function
test_indices = random.sample(population=indices, k = test_size) #take random sample of k numbers from indices
test_hdf = hdf.loc[test_indices]# it will allow us to access only those certain rows train_hdf = hdf.drop(test_indices) # to train our data we will drop those indices
return train_hdf,test_hdf
#random.seed(0) # due to random seed we will have always same sample, so we should not use this
train_hdf,test_hdf = train_test_size(hdf, test_size = 66) # to check we are having random data samples in test_hdf len(test_hdf) #print length of test_size
#Section 4 data = train_hdf.values # storing values in a numpy 2D array def classify(data):
label_column = data[:,-1]
uniq_clas, c_uniq_clas = np.unique(label_column, return_counts = True) # store classes and their numbers in array index = c_uniq_clas.argmax() # should tell which class has largest variety
classification = uniq_clas[index] #variety appear most often
return classification
def splits(data): #to make a split between middle of two unique values so it could be our potential split hdf_splits = {}
_, n_columns = data.shape for col_index in range(n_columns -1): #exclude last column from range hdf_splits[col_index] = [] #create an empty list to store unique values values = data[:, col_index] uniq = np.unique(values)
for i in range(len(uniq)): # run a loop over the unique values to take the respective element
if i !=0: # skip the first element because we cant take previous value of first elemnt
current_value = uniq[i] previous_value = uniq[i -1] # take the previous value
split = (current_value + previous_value) / 2 #take the sum and divide by 2 to make a split between
hdf_splits[col_index].append(split) #middle of two values and append the values in list
return(hdf_splits) hdf_splits = splits(train_hdf.values) #get splits from training data
#create a split function to having taking arg as data, column and value of that column def split_data(data, s_col, s_val):
s_col_val = data[:, s_col] #chose for a particular value and create above and below lists from that value hdf_1 = data[s_col_val <= s_val] #store values below and equal of chosen value hdf_2 = data[s_col_val > s_val] #store value above of chosen value return hdf_1, hdf_2 s_col = 1
s_val = 15.0 #showcasing the value for an example
hdf_1, hdf_2 = split_data(data, s_col,s_val) #call of above function
#Section 5 def entropy(data): #calculate lowest entropy using formula summation (prob)*(-log(prob)) label_column = data[:, -1] #fetching last column
_,counts = np.unique(label_column,return_counts=True) #to get the count of varieties and we need only number of counts so use_
probabilities = counts / counts.sum() #to get probability we have to divide array with sum of array entropy = sum(probabilities * -np.log2(probabilities)) #apply the formula
return entropy
def all_entropy(hdf_1, hdf_2): #function to calculate overall entropy of all data points dp = len(hdf_1) + len(hdf_2) #total data points p_hdf_1 = len(hdf_1) / dp #below data points p_hdf_2 = len(hdf_2) / dp #above data points entrpy = (p_hdf_1 * entropy(hdf_1) #calculate entropy of all data points
+ p_hdf_2 * entropy(hdf_2)) return entrpy #Section 6 def best_split(data, hdf_splits): #determine best split from all splits entrpy = 999 for col_index in hdf_splits: #run a loop over splits for value in hdf_splits[col_index]:
hdf_1, hdf_2 = split_data(data,s_col=col_index, s_val = value) c_entropy = all_entropy(hdf_1, hdf_2) #call entropy function
if c_entropy <= entrpy: #run a if condition for searching which one is having low entropy in entrpy = c_entropy #best split by comparing with overall_entropy we have set.
b_col = col_index #assigning column idex of best split to a variable
b_value = value #assigning value of best split column into another variable
return b_col, b_value
hdf_splits = splits(data) #call split function best_split(data, hdf_splits) #call best split function to get best split among all split
#Section 7
def decision_tree_algorithm(df, count=0, min_sampl = 2, max_depth = 10): #min_sampl is 2 because it is min no of data points to make a split if count == 0: #max_depth is used for pruning of tree which gives no of nodes global col_h #defining column_header globally data = df.values # we have to transform df variable into numpy 2D array for data preparation col_h = hdf.columns #column headers gets name of column
else:
data = df #base case if ((len(data) < min_sampl) or (count == max_depth)): #to check if data has minimum length classification = classify(data) #call classification function return classification #return classification else:
count += 1 #otherwise increase counter to 1 to point to other value
hdf_splits = splits(data) #once above loop is done, run potential split and best split function s_col, s_val = best_split(data, hdf_splits) hdf_1,hdf_2 = split_data(data,s_col, s_val)
#creation of sub-tree fname = col_h[s_col] #to pass the column name on which split is happening to feature name node = “{} <= {}”.format(fname, s_val) #node for the basis of split.
sub_tree = {node: []} #create sub tree as a dictionary where keys are all node and append all the leaves.
#find recursive tree to find true and false branch.
True_branch = decision_tree_algorithm(hdf_1, count,min_sampl,max_depth)
False_branch = decision_tree_algorithm(hdf_2, count,min_sampl,max_depth)
if True_branch == False_branch: sub_tree = True_branch else:
sub_tree[node].append(True_branch) #append yes leaf sub_tree[node].append(False_branch) #append no leaf
return sub_tree
classifier = decision_tree_algorithm(train_hdf,max_depth = 10)
#suppose if both leaf are same then maxdepth is already reached.
#Section 8 root = test_hdf.iloc[5] #take first row for an example def classify_node(root,classifier): #to check it is a root or leaf node = list(classifier.keys())[0] #return list which gives keys and access this list by stating [0]
fname, comparison_operator, value = node.split() #returns all the parts of the node and store it into appropriate variable
if root[fname] <= float(value): #check for the node leaf = classifier[node][0] #if yes then place that node into a leaf
else:
leaf = classifier[node][1]
if not isinstance(leaf,dict): #if leaf is not a dictionary then return leaf return leaf else:
residual_tree = leaf #if leaf is dictionary then again go to recursive function return classify_node(root,residual_tree)
classify_node(root,classifier) #calling this function here to show the output at this stage
#Section 9 def calculate_accuracy(hdf, classifier): #passing dataframe and our classifier
hdf[“classification”] = hdf.apply(classify_node,axis=1, args=(classifier,)) #first contained data and apply is used to make sure we are applying this on all rows
# ,in args has been put to interpret classifier as it is not as datatype
hdf[“Result”] = hdf.classification == hdf.label # to dispaly whether its correct or not
accuracy = hdf.Result.mean()*100 #calculate accuracy
return accuracy #return accuracy calculate_accuracy(test_hdf,classifier)
test_hdf #printing test_hdf to view which all columns have been classified correctly and which are not #Section 10 from random import seed from random import randrange
# Split a dataset into 10 folds def cross_validation_split(hdf, k=10):
hdf_split = list() hdf_copy = list(hdf) fold = int(len(hdf) / k) for i in range(k):
f = list()
while len(f) < fold:
index = randrange(len(hdf_copy))
f.append(hdf_copy.pop(index)) hdf_split.append(f) return hdf_split
k = cross_validation_split(hdf, 10) print(k)
Cite This Work
To export a reference to this article please select a referencing stye below:
Related Services
View all


DMCA / Removal Request
If you are the original writer of this assignment and no longer wish to have your work published on UKEssays.com then please click the following link to email our support team:
Request essay removal