Development of Sustainable Dwellings in Wales
| ✅ Paper Type: Free Essay | ✅ Subject: Architecture |
| ✅ Wordcount: 2830 words | ✅ Published: 30 Apr 2018 |
This study focuses on the development of a sustainable retrofit plan for a typical dwelling in Wales. There are two parts that have been discussed in this report. The first section is a full development plan to reduce the fuel cost with a budget of £30K and the second is a calculation of carbon footprint of a building element (wall insulation materials).
The project was predicted to achieve 70% reductions in CO2 emissions for a cost of some £26K.Furthermore, the energy cost would be reduced by 85% if the development plan was implemented in full. Stepwise approach has been used to measure the performance. Replacing the heating system and adding more insulation for the roof, walls and floor are considered the significant improvement of the project with reasonable payback periods.
The embodied CO2 emission for three different insulation materials has been calculated. Rockwool has the lowest rate 833 kg co2e compared to 875, 1737 to the Sheep’s wool and Expanded Polystyrene respectivel
1.1 Background
1.1.1 Introduction:
Indeed, there is a huge pressure on governments to reduce their greenhouse gas emissions. Paris agreement, is a recent agreement within the United Nations Framework Convention on Climate Change, was agreed to keep the global warming below 2°C (1). British government aims to have an 80% reduction by 2050. This means a huge improvement is needed in energy efficiency of our existing dwelling. The recent report shows that over 45% of total greenhouse emissions were emitted from dwelling building (2).The domestic sector accounted for 29 % of the total energy consumption in 2015(3).Furthermore, residential was ranked the fourth in the amount of greenhouse gas emission according to national statistics(4) the figure below show the greenhouse gas emission by different sectors.
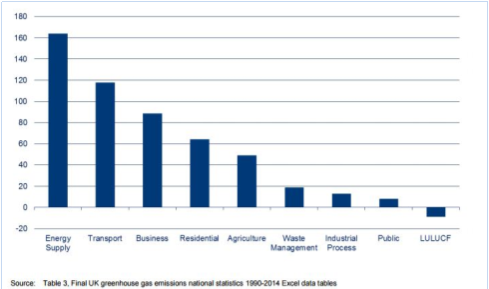
Figure (1) Greenhouse gas emission by sector (DECC), UK, 2014
1.1.2 The property:
This house was built in 1930s and has three bedrooms with South-West facing and located in Wales.
The external walls are cavity wall with plaster but without any insulation, the floor has no insulation, the roof is slate tiles with 50mm insulation between the rafters. The windows are double glazed, with a 6mm air gap, PVC frames and with U value of 2.8.The doors are also PVC frame with U value of 2.8. The heating system is an old mains gas boiler with 65% efficiency, the capacity of hot water tank 120 litre.
1.1.3 Performance prior to refurbishment:
This house has a SAP rating of 45, below the national average of 48 and therefore there is a need to improve its performance to achieve 80 % of reduction in emissions as well as the annual fuel cost. This could be achieved by reducing the heat loss through the walls, floor, roof as well as windows and doors.

1.2 Development plan
There are two factors that are set to dramatically transform the way in which building was designed and fabricated in the early twenty-first century-insulation and energy. There is a need to maximise the insulation levels of the buildings while at the same time rethinking the ways in which building consumes the energy needed to run them.
Step 1: Upgrading the heating system :
Modern boilers are more efficient because they burn the fuel very efficiently. The fuel type also has a direct impact on reducing the fuel bill as well as carbon emissions. The condensing gas boiler (90% efficacy) with room thermostat is the best choice in this matter.
Step 2: Insulating the roof, floor and walls:
The challenge in adding insulation levels in domestics is to choose the right materials that fit for purpose. Understanding the properties of the materials and when it is suited to fitting in the attic space is essential. Moreover, price, fire safety, chemicals involved and end of life should also be considered when choosing the material (5).
-Floor: Phenolic foam insulation would offer the best performance of any readily available panel (6). It also has less impact on room size where dry-lining is considered. Kingspan’s Kooltherm phenolic is the good option for floors. The designed U value for floor is 0.2 W/m2K.
-Cavity wall insulation: Filling the cavity gap between the inner and outer blocks with appropriate insulation material has been considered. However, it is highly likely that insulating the cavity alone will not be enough to achieve the required U-values. For this reason, adding internal or external insulation should also be concerned to achieve the targeted U-value. The designed u value for injected insulation with external wall insulation (Rockwool) is 0.49 (W/m2K).
-Roofs: mineral wool insulation is highly recommended for roof insulation, 160 mm is added between rafters and 100 mm below them. The designed U value in this case is 0.15 (W/m2K).
Step 3: Minimising infiltration (disuse chimneys, draught proofing).
Ventilation is needed in traditional buildings to help the fabric ‘breathe’. Chimneys would have contributed greatly to the ventilation rate, so it is advised, in some cases, that chimneys could to be left open to allow natural ventilation. However, disused chimney, if left fully open, will often cause more heat loss. It also can let water in, if it is uncapped. Some methods can be recommended:
- CAPS: a cap at the top of a chimney will prevent water ingress but allow through ventilation. However, caps can cause huge damage and be very dangerous if they blow off in case of windy weather.
- Balloons: is the quickest and cheapest way to close of a flue that is not being used, but it is awkward and dirty when removing and reinstalling them in place.
Step 4: Reducing the energy consumption for lighting (LED).
LED lighting is extremely energy efficient technology and has changed the future of lighting worldwide. The residential LED lighting use less 70% energy and last 25 times longer life (7). The value of lighting gain in the SAP calculation (67) was reduced by 70% of the original value.
Step 5: Installing renewable sources (PV panel).
The solar photovoltaic (PV) has many advantages that a householder can benefit from. The main benefit is to cut electricity bill as well as sell the left over electricity to the grid. Not to mention, the sunlight is free and that means nearly zero carbon footprint (8). It is advised the Monocrystalline system with 20% efficiency is required to generate around 2700kWh annually. This system requires 21 square meter roof space and makes saving around 12p/kWh from electricity bill. However, if a householder doesn’t use the electricity produced, exported to grid or store it in batteries are the only two options available. The storage technology has been ignored because the cost and complexity with installing at dwelling. The exported tariff is 3.1 p/kWh, but this figure could be ignored as the power generated by the system would be absorbed by the site demand.
Step 6: UPVC triple glazing windows
The huge heating loss in domestics occurs through windows. There is a growing range in this area to improve the thermal performance of this element. Triple glazing is the best options that could be considered to achieve the reduction target. This element has an excellent U-value (one or less) which provide a decrease in energy consumption as well as reducing CO2 emissions.
Step 7: UPVC high efficient door
It is suggested that the original doors on the property, with a U-value of 2.8 W/m2.K, should be replaced with a high performance triple glazed door, reducing the U-value of the surface by 65%.
1.3 Alternatives options
Other systems were also considered but rejected due to the cost-effectiveness as well as the project size. For example:
- Mechanical ventilation with heat recovery (MVHR): is widely used for highly energy efficient buildings in the UK. However, the complexity to install and the high capital cost, the system was ignored.
- Under floor heating: is a modern technology that allows the householder to enjoy the luxury of the warm floor during the winter. In other hand, under floor system is pricey to install in retrofit house and more difficult to maintain if any problem occurs.
- Wind turbine: roof-mounted and freestanding mast wind turbines are two types that can be installed in the project. The micro wind turbine was rejected because the space limitation, the turbine noise and save the birds in the local area.
1.4 Analysis and evaluation
- SAP rating: the graph (1) illustrates the improvement of the SAP rating though the development plan. It is clearly seen that the property has been developed from 45.65 to over 90 and that means the house can achieve band B in the EPC.
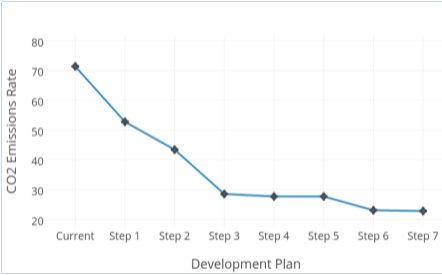
- CO2 emissions rate: As it can be seen from the graph (2) below, a significant decrease in CO2 emissions though the development plan. The house would benefit of 70% reduction on CO2 emissions as the plan reduced CO2 emissions rate from 71.35 to below 22.77.
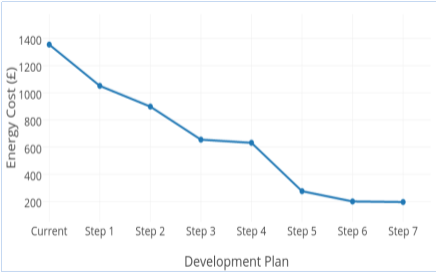
- Energy cost: The annual fuel cost has been reduced from £1354 to below £200 as graph (3) indicates. A reduction of 85% of annual energy bill will be achieved if the designed plan is implemented.
- The project’s budget was £30K; however, the full money spent in this plan is around £26K. The simple payback method has been used for financial evaluation. The full plan will require 20 years to recover the cost of the project.
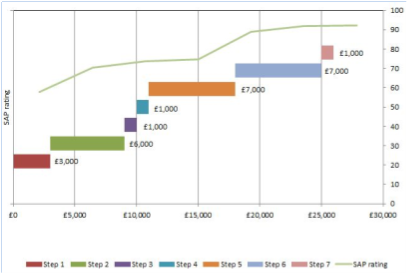
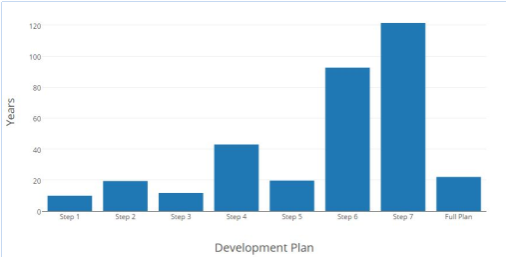
- The plan is designed in stepwise to achieve higher performance as well as keep the cost low as much as possible. The graph (4) shows that SAP rating improvement against the cost for each step. Replacing windows and doors would cost over £7000 and £1000 respectively; with having longer payback periods (graph 5), that took them to the end of the list.
Note: Full data can be found in the appendix (table 3).
|
|
|
|
Graph (1) SAP rating during the development plan |
Graph (2) CO2 emissions rate through the development plan |
|
|
|
|
Graph (3) Annual energy cost through the development plan |
Graph (4) SAP improvement vs. Cost |

Graph (5) Simple payback calculation for development plan
1.5 Conclusion
- The project will benefit significantly by replacing the heating system as well as adding more insulation for the roof, floor and walls. However, replacing windows the doors have slight effect on the house performance as it costs more with less benefit.
- Installing photovoltaic panels will make a huge impact on the project performance. It would make saving over 55% from the energy bill if 3 KWp panel was installed.
2.1 Introduction
The thermal resistance provided by insulation materials used in the building fabric means that the energy savings from insulation made during the operation of the building far outweigh its embodied environmental impacts. Also, insulation products tend to have a very low density and, therefore, when reviewed in a building context, only relatively small masses of materials are used. However, if insulations are not assessed with a whole-building life-cycle approach they may not appear to be an inherently low environmental impact material, because of the resources and energy used during manufacture, the use of blowing agents and the lack of reuse/recycling at the end of life. This study will illustrate the environmental impact of three different types of insulation; it also provides the carbon footprint calculation for the project that was refurbished in the Part 1.
2.2 Literature survey
The Green guide classifies the insulation used in the construction into:
- Non-renewable organic-based insulation such as expanded polystyrene (EPS); this material has conductivity 0.038 W/mK, density 37 kg/m3. It is a rigid, open cell form of polystyrene blown with pentane. EPS is a thermoplastic polymer, so can be reprocessed and recycled more easily than thermoset polymers. Most process waste is recycled but there is limited recycling of postconsumer packaging.
- Renewable organic plant/animal-derived insulation such as Sheep’s wool insulation; it has conductivity 0.039 W/mK, density 25 kg/m3. The sheep’s wool that is not suitable for textiles, is used for insulation. The wool needs to be scoured, requiring energy and water, and the resulting pesticide residue from the sheet dip needs treatment. Binders and polyester fibre are required, as well as chemical treatment to prevent moth attack.
- Mineral wool insulation such as Rockwool; is a medium density insulation product of 45 kg/m3 and has a thermal conductivity of 0.044 W/mK. Rockwool is made of 77% virgin raw material mainly in the form of diabase, gotland stone, lime stone, cement and bauxite. The remaining 23% are classed as waste materials.
End-of-life issues for insulation
Many insulation types are recyclable at end of life, but do not currently have any recycling system in place for material recovered from construction, refurbishment or demolition. There is evidence that some insulation waste from construction is incorporated elsewhere within the building, rather than being sent for disposal. For most materials, the impact associated with end of life is the disposal impact measured by BRE relating to the amount of material landfilled or incinerated. The BRE methodology also includes the emissions associated with incineration and landfill, including burning of landfill gas. For renewable materials, the end-of-life stage can have a significant impact if the sequestered carbon is released back into the environment through incineration or decay in landfill.
Table (1) End-of-life waste destination (reference 11)
|
Insulation |
End of life waste destination (%) |
||
|
Landfill |
Incineration |
Recycled |
|
|
Expanded polystyrene (EPS): |
90 |
9 |
1 |
|
Sheep’s wool |
100 |
0 |
0 |
|
Rockwool |
40 |
10 |
50 |
2.3 Carbon footprint calculation
The construction carbon calculator is used to determine the environmental impact for insulation materials. This tool was downloaded from the government’s website (12).
- CO2 emissions calculation:
The table below shows the total amount of co2 emissions for the three types of insulation.
Table (2) Carbon footprint calculation for EPS, Sheep’s wool and Rockwool
|
Reference |
Unit |
Expanded Polystyrene |
Sheep’s wool |
Rockwool |
|
|
Wall area |
m2 |
110 |
110 |
110 |
|
|
Insulation thickness |
Assumption |
m |
0.1 |
0.1 |
0.1 |
|
Volume of insulation |
m3 |
11 |
11 |
11 |
|
|
Density |
Ref (13) |
kg/m3 |
37 |
25 |
45 |
|
Mass |
kg |
407 |
275 |
495 |
|
|
Waste 5% |
Assumption |
kg |
427.35 |
288.75 |
519.75 |
|
Carbon coefficient |
Ref(14) |
kgco2/kg |
3.43 |
2.09 |
1.12 |
|
Embodied CO2 |
kg co2e |
1465.8105 |
603.4875 |
582.12 |
|
|
Boundary |
Ref(14) |
cradle to gate |
cradle to gate |
cradle to grave |
|
|
Transport of material |
Manufacturer website |
200 miles from Kent by road |
175 miles from Liverpool by road |
Non |
|
|
Transport Embodied CO2 |
kg co2e |
19 |
19 |
0 |
|
|
Waste destination |
Ref(11) |
90% landfill |
100% landfill |
50% landfill |
|
|
Waste mass |
kg |
366.3 |
275 |
259.875 |
|
|
Waste Embodied CO2 |
kg co2e |
3.19 |
3.48 |
1.7 |
|
|
Transport of waste |
Assumption |
miles |
100 |
100 |
100 |
|
Transport waste Embodied CO2 |
kg co2e |
0.2 |
0.2 |
0.2 |
|
|
Total waste Embodied CO2 |
kg co2e |
3.39 |
3.68 |
1.9 |
|
|
Energy consumed |
Assumption |
Kwh |
200 |
200 |
200 |
|
Plant CO2 emissions |
kg co2e |
119 |
119 |
119 |
|
|
Project duration (days) |
Assumption |
3 |
3 |
3 |
|
|
Travel CO2 emissions |
kg co2e |
130 |
130 |
130 |
|
|
Total |
kg co2e |
1737.2005 |
875.1675 |
833.02 |
2.4 Conclusion
As it can be seen from the previews calculation, the highest embodied CO2 emission is Expanded Polystyrene because of the higher carbon coefficient and end-of-life issue. For that reason EP is out of consideration. Sheep’s wool is natural source, absorbing and releasing moisture without decreasing its thermal insulating properties. However, it has more CO2 emissions than Rockwool which also take it out of thought. In addition to Rockwool has less embodied CO2 emissions, it has excellent thermal insulation with more flexibility to install. Mineral wool has also superior fire resistance as well as better acoustic properties.
- The Paris Agreement – main page (2001) Available at: http://unfccc.int/paris_agreement/items/9485.php (Accessed: 14 February 2017).
- DECC (2011), The Carbon Plan: Delivering Our Low Carbon Future, p.29.
- Department of Energy and Climate Change. Digest of United Kingdom energy statistics (DUKES). Available at: http://www.decc.gov.uk/en/content/cms/statistics/ publications/dukes.
- Government Statistics (no date) Available at: http://4.https://www.gov.uk/government/uploads/system/uploads/attachment_data/file/496942/2014_Final_Emissions_Statistics_Release.pdf (Accessed: 14 February 2017).
- Technology Strategy Board, 2014. Reducing energy use in existing homes, a guide to making retrofit work. RETROFIT FOR THE FUTURE, 1, 15.
- D Pickles, I Brocklebank & C Wood, 2010. ENERGY EFFICIENCY IN HISTORIC BUILDINGS: Open fires, chimneys and flues. nglish Heritage, 1, 17.
- LED Lighting | Department of Energy. 2017. LED Lighting | Department of Energy. [ONLINE] Available at: https://www.energy.gov/energysaver/led-lighting. [Accessed 15 February 2017].
- R. Sadgrove & S.Pester, 2014. Installation of photovoltaic panels on existing flat roofs – some lessons learned. BRE Information Papers, IP 8/14, 7.
- SEI, Retrofitted Passive Homes, 2009. Retrofitted Passive Homes: Guidelines for upgrading existing dwelling in Ireland. Retrofitted Passive Homes, 1, 15.
- Shorrock L D and Utley J I. Domestic energy fact file 2003,BRE BR 457. Bracknell, IHS BRE Press, 2003.
- K Albury & J Anderson , 2011. Environmental Impact Of Insulation . BRE TRUST, 2011. 10
- Government Website. 2007. Construction Carbon Calculator. [ONLINE] Available at: https://www.gov.uk/government/organisations/environment-agency/about/procurement. [Accessed 28 February 2017].
- http://jablite.co.uk. 2016. Jablite EPS . [ONLINE] Available at: http://jablite.co.uk/wp-content/uploads/2016/01/Jablite-EPS.pdf. [Accessed 28 February 2017].
- Sheep Wool Insulation Premium. 2016. Sheep Wool. [ONLINE] Available at: http://www.sheepwoolinsulation.ie/products/premium_insulation_technical.asp. [Accessed 28 February 2017].
- Prof.Hammond & Jones, Prof.G and C, 2011. The Inventory of Carbon and Energy (ICE). 1st ed. UK: University of Bath
Table (3) Full data of the development plan
|
Current |
Step 1 |
Step 2 |
Step 3 |
Step 4 |
Step 5 |
Step 6 |
Step 7 |
|||
|
Overall Assignment Results |
Current |
New boiler |
Insulated Floor |
Insulated walls |
Insulated roof |
Minimising infiltration |
LED lighting |
PV panel |
UPVC Triple glazing |
UPVC door |
|
Dwelling volume (m³) |
223.6 |
223.6 |
223.6 |
223.6 |
223.6 |
223.6 |
223.6 |
223.6 |
223.6 |
223.6 |
|
Effective air change rate |
1.2261 |
1.2261 |
1.2261 |
1.22614 |
1.2261 |
0.66878 |
0.6688 |
0.6688 |
0.66878 |
0.668784 |
|
Ventilation type |
24d |
24d |
24d |
24d |
24d |
24d |
24d |
24d |
24d |
24d |
|
Fabric heat loss (W/K ) |
309.66 |
309.66 |
213.77 |
130.25 |
123.37 |
123.37 |
123.37 |
123.37 |
84.28 |
82.28 |
|
Total fabric heat loss (W/K ) |
339.06 |
339.06 |
243.17 |
159.65 |
152.77 |
152.77 |
152.77 |
152.77 |
113.68 |
111.68 |
|
HLP (W/m²K ) |
4.2377 |
4.2377 |
3.2917 |
2.46769 |
2.3998 |
1.99406 |
1.9941 |
1.9941 |
1.60841 |
1.588676 |
|
Heat gains from water heating, (kWh) |
1489.6 |
1489.6 |
1489.6 |
1489.65 |
1489.6 |
1489.65 |
1489.6 |
1489.6 |
1489.65 |
1489.648 |
|
Average Internal gains (W) |
485.09 |
485.09 |
485.09 |
485.085 |
485.09 |
485.085 |
468.49 |
468.49 |
468.494 |
468.4936 |
|
Average Solar gains (W) |
339.96 |
339.96 |
339.96 |
339.956 |
339.96 |
339.956 |
339.96 |
339.96 |
254.967 |
254.9673 |
|
Mean Internal temperature (C°) |
17.534 |
17.534 |
18.063 |
18.6402 |
18.695 |
19.0535 |
19.043 |
19.043 |
19.3723 |
19.39251 |
|
Space heating requirement in kWh2/m2/year |
203.94 |
203.94 |
160.8 |
119.082 |
115.45 |
91.3375 |
92.201 |
92.201 |
72.9319 |
71.72854 |
|
Efficiency of main space heating system 1 (in %) |
0.66 |
0.9 |
0.9 |
0.9 |
0.9 |
0.9 |
0.9 |
0.9 |
0.9 |
0.9 |
|
Efficiency of water heater |
0.66 |
0.9 |
0.9 |
0.9 |
0.9 |
0.9 |
0.9 |
0.9 |
0.9 |
0.9 |
|
Fuel for water heating, kWh |
4281.2 |
3139.5 |
3139.5 |
3139.54 |
3139.5 |
3139.54 |
3139.5 |
3139.5 |
3139.54 |
3139.544 |
|
Electricity for pumps, fans and electric keep-hot |
0 |
0 |
0 |
0 |
0 |
0 |
0 |
0 |
0 |
0 |
|
Electricity for lighting (calculated in Appendix L) |
284.43 |
284.43 |
284.43 |
284.428 |
284.43 |
284.428 |
85.328 |
85.328 |
85.3283 |
85.32833 |
|
Energy saving/generation technologies |
0 |
0 |
0 |
0 |
0 |
0 |
0 |
-2700 |
-2700 |
-2700 |
|
Average Fuel costs (p) |
8.335 |
8.335 |
8.335 |
8.335 |
8.335 |
8.335 |
8.335 |
9.306 |
9.306 |
9.306 |
|
Additional standing charges |
174 |
174 |
174 |
174 |
174 |
174 |
174 |
174 |
174 |
174 |
|
Total energy cost |
1354.5 |
1050.7 |
< | |||||||
Cite This Work
To export a reference to this article please select a referencing stye below:
Related Services
View all


DMCA / Removal Request
If you are the original writer of this essay and no longer wish to have your work published on UKEssays.com then please click the following link to email our support team:
Request essay removal