Conversion of Waste to Energy
| ✅ Paper Type: Free Essay | ✅ Subject: Environmental Studies |
| ✅ Wordcount: 4029 words | ✅ Published: 04 Sep 2017 |
This section of the report focuses on waste to energy which is one of the most popular methods used to manage municipal solid waste around the world. Through waste to energy, trash has become a useful material because we are able to convert it to heat. The combustion of trash at a waste to energy facility produce ash, heat and flue gas. From the ash, metals are recovered and recycled. The flue gas is cleaned then it is released into the atmosphere through the chimney. The heat produced is used to generate electricity that powers the plant and nearby buildings. A waste to energy plant in the community helps to increase recycling rate which is beneficial for the city. There are more advantages to waste to energy than disadvantages, therefore it is essential that the city utilizes waste to energy has a way of managing municipal solid waste.
4.1.1. Introduction
The management of municipal solid waste (MSW) in New York City has changed over the past decade from ocean and street dumping, to unregulated incineration, to current and export landfilling practices (Sylvan, 2011). The NYC Department of Sanitation, which is in charge of managing NYC waste collaborates with the Department of Parks and Recreation, the Sims Multi Recycling Recovery Facility, and GreeNYC to manage the city’s waste through recycling, waste reduction, and composting and organic waste diversion (Cohen et al., 2015). In 2006, to efficiently manage the city’s waste, the city Council approved the Comprehensive Solid Waste Management Plan (SWMP) which was created under the administrator of former Mayor Bloomberg (Cohen et al., 2015). The purpose of this plan was to establish a dependable, economical, and sustainable system for managing the city’s waste (Cohen et al., 2015). This plan was eventually integrated into the sustainability planning under the PlaNYC, New York City’s comprehensive sustainability plan in 2011 (Cohen et al., 2015). Under the new plan, in 2012, Former Mayor Bloomberg announced that the city would solicit plans to build a waste to energy facility near or within New York City (Rizzo et al., 2012). Waste to energy (WTE) technology is a process where trash is converted to heat/electricity. The most common waste to energy technology use around the world is mass burn, where trash is combusted to produce energy (Citizen Budget Commission, 2012). However, the plan to build a WTE facility was eventually archived due to misconceptions surrounding WTE (Rizzo et al., 2012).
4.1.1.1 Background on the Problem
Incinerators are not new to New York City. In the 20th century, there were thirty-two municipal and 17,000 apartment house refuse incinerator in the city (Walsh et al., 2001). In 1935, New York City was forced to stop ocean dumping, which was the waste disposal method for the city at that time, after a federal lawsuit was filed by New Jersey coastal cities (Cohen et al., 2015). This led the city to rely on incinerators and landfill to dispose of its waste (Cohen et al., 2015). However, in 1952, city’s officials reported that apartment house refuse incinerators were responsible for 30% of the city’s air pollution (Walsh, 2002). The report on air pollution caused by incinerators in the 1950s led to the limits on incinerator usage based on environmental grounds (Walsh, 2002). In 1970, after the Federal Clean Air act was enacted, the city was forced to shut down incinerators plant that did not meet the emissions guidelines (WastedNYC, 2015). The emission guidelines led to the closure of the city’s four oldest municipal incinerators by 1971, and by mid- 1970s thousands of residential incinerators were closed down (Walsh, 2002). In 1989, City Council committee passes a bill to ban incinerators in the city in the next four years (WastedNYC, 2015; Dunlap, 1989). This bill led to the decline of both residential and municipal incinerators, and by 1994 there were no more incinerator plants in New York City (Walsh, 2002; Rizzo et al., 2012).
4.1.1.2. Purpose of the Paper
The burning of garbage and WTE are related because they both involve the combustion of trash. However, WTE is not just about burning trash but it is used to produce energy. The purpose of this paper is to outline how WTE plants work as well as the benefit the city stands to gain if it builds its own WTE facility. The city currently sends approximately 10% of its MSW to WTE plants in Hempstead, Long Island and Essex County, New Jersey (Cohen 2015, Citizen Budget Commission, 2012). If the city were to build its owns plant, it would save money from not spending on the transportation of waste and the use of other state’s landfills or WTE facilities. WTE has the ability to improve New York City’s current waste disposal practices (Citizen Budget Commission, 2012).
4.1.2. Municipal Solid Waste Incinerator Process
4.1.2.1. How Incineration Works
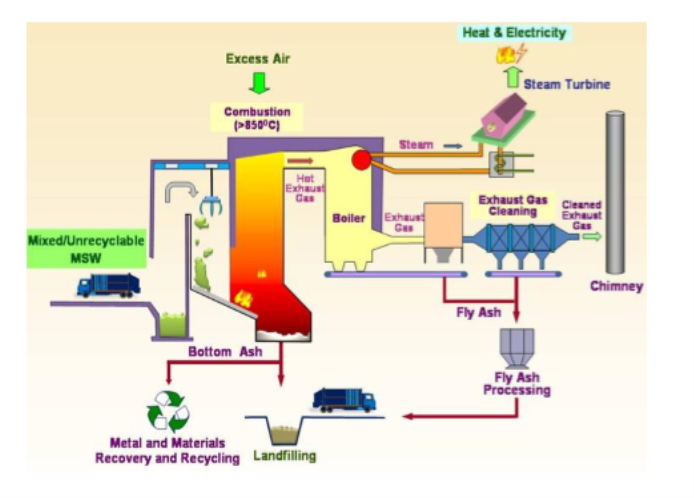
Figure 4.1.1: Schematic Diagram of the MSW incineration process (Lam et al., 2010).
The incineration process of MSW is separated into three main parts: combustion, energy recovery and air pollution control (Lam et al., 2010). The crane in the machine (upper left, Fig.4.1.1) is used to feed solid waste into the furnace of the machine continually for combustion (Lam et al., 2010). The combustion of the waste in the furnace is enhanced by following the three T’s guideline, which are temperature, turbulence and time (Lam et al., 2010). High temperature increases burnout of the waste, while increasing turbulence reveals more waste surface and also increases burnout. (Lam et al., 2010). A longer resident time for the flue gas and waste also increases burnout (Lam et al., 2010). The temperature for incineration should be at least 850 oC with a residence time of 2 minutes (Lam et al., 2010). Air supply must be sufficient during the process to ensure complete combustion of waste and to inhibit the formation of carbon monoxide and dioxins (Lam et al., 2010).
For the energy recovery process of the system, heat is generated from the waste and it is used to produce steam in the boiler (Lam et al., 2010). The steam is then used to drives the turbine to generate electricity (Lam et al., 2010).
Air pollution was a major problem for old incinerators in the 20th century. However, modern incinerators are equipped with advanced pollution control systems which are designed to reduce pollution and ensure that the system is in compliance with environmental standards (Lam et al., 2010). To neutralize acidic gases such as hydrogen chloride and sulfur oxides, fine atomized slurry or lime powder is spray into the hot exhaust gas using a dry/wet scrubber (Lam et al., 2010). Also in the system, an activated carbon column is used to adsorb the heavy metals and organic pollutants such as polychlorinated biphenyls (PCB) and volatile organic compounds (VOC) in the exhaust gas (Lam et al., 2010). The bag filter install in the system acts to filter and remove dust particles and fine particulates from the combustion (Lam et al., 2016).

4.1.2.2. The Product of Incineration of Waste
After the combustion of the waste three products are produced, the products are flue gas, heat and ash (Lam et al., 2016).
4.1.2.2.1. Flue gas
The flue gas produced from the combustion contains air pollutant (Zaman, 2010) (See table 4.1.3). Therefore, before the flue gas is release through the chimney, the filtering system makes sure the gas is clean to be released into the atmosphere (Zaman, 2010).
4.1.2.2.2. Heat
The heat produced is used to generate electricity. The facilities use the electricity generated to operate the plant and sell the excess energy (Chambers, 2016; Citizen Budget Commission, 2012). At most facilities, for every ton of waste combusted, 550 to 650 Kilowatt/hour (KWh) of electricity is generated for sale (Citizen Budget Commission, 2012). This is the way that WTE facilities are able to earn more income for the plant (Citizen Budget Commission, 2012).
4.1.2.2.3. Ash
There are two types of ash produced from the combustion, bottom ash (BA) and fly ash (FA) (Lam et al., 2016). The ash is 90 percent smaller than the original volume of the waste combusted (Citizen Budget Commission, 2012). From the ash, WTE facilities are able to extract recyclable ferrous and non-ferrous metals (Chambers, 2016; Citizen Budget Commission, 2012). Then the ashes are landfilled (Chambers, 2016). Before the ashes are landfilled, the facilities test the ashes to make sure that the ashes are not hazardous to the environment (Chambers, 2016). However, in some Asian and European countries that uses WTE, the ashes are not landfilled but rather utilized for other purposes such as cement and concrete production, road pavement, glass ceramics and ceramic production, adsorbent for dyes and agriculture (Lam et al., 2010; Pérez-Villarejo et al., 2012).
|
Application of MSW ashes |
|||
|
Type |
Application |
Composition % |
Country |
|
BA |
Aggregate in concrete |
up to 50% |
France |
|
BA |
Aggregate in concrete |
replace up to 15% of cement |
Slovenia |
|
BA |
Road base |
Spain |
|
|
BA |
Adsorbent for dyes |
India |
|
|
BA |
Concrete |
Italy |
|
|
Mixed Ash |
Cement clinker |
up to 50% |
Portugal |
|
Mixed Ash |
Cement clinker |
44% |
Japan |
|
Mixed Ash |
Cement clinker |
15% |
Taiwan |
|
Mixed Ash |
Aggregate in concrete |
Spain |
|
|
FA |
Concrete |
50% |
France |
|
FA |
Eco cement |
50% |
Japan |
|
FA |
Ceramic tile |
China |
|
|
FA |
Glass ceramic |
Korea |
|
|
FA |
Blended cement |
up to 45% |
UK |
Table 4.1.1: The uses of MSW Ash in different countries. The BA represents Bottom Ash, the FA represents Fly Ash and the Mixed Ash represents the mixture of both BA and FA (Modified after Lam et al., 2010).

Table 4.1.2: Research projects on MSW ash as road construction materials in the U.S. BA represents Bottom Ash and combined ash represents both Bottom Ash and Fly Ash (Modified after An et al., 2014).
WTE facilities in the United States(U.S.) such as Covanta have been lobbying to recycle the ash instead of landfilling it, but these attempts have been unsuccessful so far (Chambers, 2016). The facilities have been lobbying for both federal and state regulation that would allow the usage of ash in the country (Chambers, 2016). Several studies conducted in the U.S. has proved that ash can be used in the U.S. as part of road construction (An et al., 2014) (see table 4.1.2). Despite the research showing that ash is usable in the U.S. no regulation has been passed to allow the usage of ash (An et al., 2014). Recycling of ash would be beneficiary because it would help eliminate landfills. Therefore, it is essential that these facilities continue to lobby for the recycling of ash.
4.1.3. Misconception about Waste to Energy
Opposition to waste to energy plant in the city is rooted in two misconceptions (Citizen Budget Commission, 2012). One of the misconceptions is that a waste to energy plant would displace recycling programs in the city (Citizen Budget Commission, 2012). This has been proven to be false based on places that use waste to energy as part of their waste management program (Citizen Budget Commission, 2012). High reliance on WTE is in fact correlated with high recycling rate (Citizen Budget Commission, 2012). For example, in Austria where WTE facilities are used, 70 percent of its MSW is either recycled or composed while the remaining 30 percent is sent to WTE plants (Citizen Budget Commission, 2012). Meanwhile, in the U.S., studies have shown that states that do not rely heavily on WTE to manage their waste have a recycling rate below 20 percent while states that rely heavily on WTE has recycling rates above 20 percent. (Citizen Budget Commission, 2012). For example, Connecticut, which is one of the leading states in reliance on WTE, sends 63 percent of its waste to WTE plants and recycle d 26 percent of its waste (Citizen Budget Commission, 2012). As of 2015, the recycling rate for the city was 16%, which is lower than the recycling rate for Connecticut (Szendro, 2015). This demonstrates that having a WTE plant in the city would not displace recycling but rather help us recycle better.
The other misconception about WTE is that it causes air pollution which would affect the health of the resident that would who live around the plant (Citizen Budget Commission, 2012). In the 20th century there was a problem with incineration due to the fact that it causes air pollution. However, modern incinerators are equipped with systems that reduce the amount of pollutants released from the plant (Citizen Budget Commission, 2012). Also tight rule and regulations have led to the reduction of pollutant from WTE plants (Chambers, 2016). Under the federal Clean Air Act, WTE facilities must abide by the Maximum Achievable Control Technology (MACT) rules, which apply to eight different air pollutants (Citizen Budget Commission, 2012). Every five years, the Environmental Protection Agency (EPA) updates the MACT, which result in the update of pollution control in WTE facilities to meet the new EPA limits (Citizen Budget Commission, 2012). In 2012, the New York Department of Environmental Conservation (DEC) examined eight air pollutants at the state’s municipal waste combustion plants and found that most pollutant had declined by 30 to 60 percent from 1996 to 2010 (Citizen Budget Commission, 2012).

*Toxic equivalent (sum of substance amounts multiplied by toxicity equivalency).
Table 4.1.3. Emission from US WTE facilities Pre- versus Post MACT (Modified after EPA, 2016).
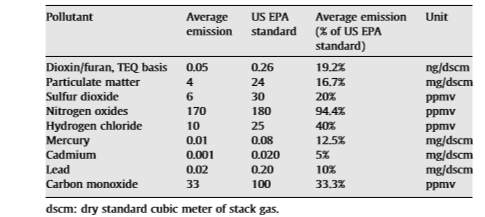
Table 4.1.4. Average emission of 87 US WTE facilities (Lumber et al., 2006 as citied in Psomopoulos et al., 2009).
WTE facilities in the US emit pollutants that are below that of the EPA Standard (Chambers, 2016, Psomopoulos et al., 2009) (see table 4.1.4). Numerous studies have shown that modern combustion plants pose no significant health risks (Citizen Budget commission., 2012). For example, a study in Germany, found near new WTE facilities the dioxin levels are only 1 to 2 percent of the level considered harmful to human health (Citizen Budget Commission., 2012). Another example, in Montgomery County WTE facility a health risk assessment found that even in the worst case scenario a nearby farmer has a one in three million chance of increase health risk from exposure to the facility(Budget Citizen Commission., 2012). This shows that WTE plants have no effect on human health and the idea that WTE plants in the city would affect the health of New Yorkers is false.
4.1.4. Benefit of Waste to Energy
4.1.4.1. Energy production and reduction in Greenhouse gases
At WTE plants, combustion of 1 metric ton of MSW generates approximately 600 kWh of electricity thus preventing the mining of 0.25 ton of U.S. coal or importing one barrel of oil for electricity (Psomopolous et al., 2009). This lead to the displacement of energy produced at local facilities (Citizen Budget Commission., 2013). For example, the EPA calculated that for a ton of wasted combusted in the Middle Atlantic region prevent about 0.56 metric tons of emission from local utilities (Citizen Budget Commission, 2012). The EPA also estimated that for every ton of waste combusted, 0.04 tons of carbon dioxide from metal recovery is saved (Citizen Budget Commission, 2012). WTE is the only alternative to landfilling of non-recyclable wastes, where the decomposing waste releases methane into the atmosphere (Psomopoulos et al., 2009). Which means that the city practice of hauling waste to other state’s landfill is increasing the city’s carbon footprint. Disposing of the city’s garbage to local WTE would decrease the city’s carbon foot print (Citizen Budget Commission., 2012).
4.1.4.2. Source of Renewable Energy
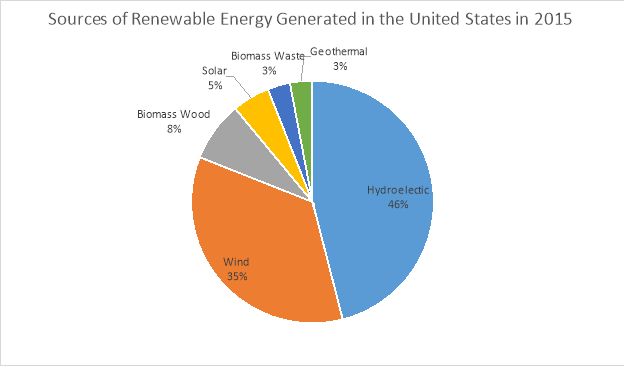
Figure 4.1.2. Sources of U.S. electricity generation in 2015 (Modified after EIA, 2016).
The combustible materials in MSW consist of 82% biomass (paper, food, yard wastes etc.), and 18% petroleum chemical wastes (Psomopolous et al., 2009). Therefore, MSW is considered a renewable source of energy and it is included by the U.S. Department of Energy in the biomass fuel category of renewable energy source (Psomopolous et al., 2009). In 2015, renewable energy generated 13% of the energy produced in the U.S. (EIA, 2016). The electricity produced by WTE facilities in the U.S. is 3% of the renewable energy generated in 2015, which is less than the amount of electricity generated by other renewable energy sources such as wind (35% of renewable energy generated), and solar (5% of renewable energy generated) (EIA, 2016) (see Figure 4.1.2). However, compare to wind and solar energy, the electricity generated by waste is consistent because the availability of these resources is stable, while the amount of electricity generated by the wind and solar energy depend on daily and seasonal weather, and this make the sources unreliable. (EIA, 2016). This shows that even though waste is not generating a lot of energy, it is a stable energy resource.
4.1.4.3. Recycling
Having a WTE plant in the city would increase the city’s recycling rate. WTE plant in the city would burn only non-recyclable material, which means that New Yorkers have the responsibility of sorting out their garbage before it is taken to the WTE plant (Citizen Budget Commission, 2012).
4.1.4.4. Free Amenities
The people who live near the WTE plant might be entitled to free amenities. For example, the Toshima Incinerator plant in Tokyo has a swimming pool and an affordable fitness center located within the plant (Harden, 2008). These amenities are accessible to the people who live in community where the plant is located (Harden, 2008). Another example, is the Hiroshima Naka City’s Incinerator plant in Japan, which is also known as the museum of garbage (Harden, 2008). The end of one of Hiroshima’s main boulevards, overlooks the city’s harbor, but the building has entirely blocked residents’ access to the water(Bernstein,2004). Therefore, the architect of the building decided to continue the boulevard, in form of a raised, glass-enclosed walkway (Bernstein, 2004). Beginning where the pavement ends, a 400-foot walkway slips was put through the building, ending in a new waterfront park. Residents can walk through the slip to get access to the waterfront park (Bernstein, 2004). The beautiful architecture of the plant has made it a tourist attraction center in Hiroshima (Bernstein, 2004). This proves that WTE plants can be multifunctional. If the city decides to build its own WTE plants it can make it attractive to the community by including free amenities.
4.1.5. Economic Analysis
In 2012, the average price of sending our waste to distant landfill was $95 per ton and it was estimated that the price would increase to $140 per ton in 2016 (Citizen Budget Commission, 2012). Meanwhile sending our waste to WTE facilities in Newark, New Jersey, and Hempstead, Long Island cost the city $66 and $77 per ton, respectively (Citizen Budget Commission, 2012). The prices for sending our waste to distant landfill and WTE facilities is expected to increase in the coming years (Citizen Budget Commission, 2016). In comparison, the projected tipping fees of new plants are much lower than sending our waste out of the city (Citizen Budget Commission, 2012). The New York City Independent Budget Office (IBO) estimated that the tipping fee at a new WTE plant that process 900,000 tons of waste per year would cost about $108 per ton in 2019, which is cheaper than the $140 per ton in 2016 for landfill (Citizen Budget Commission, 2012). Therefore, it would be beneficiary for the city to build its own plants.
A full detail on economic analysis regarding WTE can be found in section 4.4 of this report.
4.1.6. Recommendation
The use of a WTE plant located in the city or near the city offers both economic and environmental benefits compared to sending our waste out of the City (Citizen Budget Commission, 2012). Different factors are involved in estimating the economic benefits from the use of city’s own WTE facility (citizen Budget Commission, 2012). The Key factors for the estimation are the future price of transporting waste to landfills, and the time it would take to plan, design and construct a plant (Citizen Budget Commission, 2012). Therefore, the cost of WTE would be compared to the amount the City would be paying to export its waste in 2022 (Citizen Budget Commission, 2012). It is estimated that in 2022 the City would be paying $170 per ton to export to landfill (Citizen Budget Commission, 2012).
It would cost the City $750 million to finance a 3,000-ton per day WTE plant and capital funding, cost of operations and net of electricity sales for the plant would be approximate $109 million in 2022 (Citizen Budget Commission, 2016). It is assumed that the plant would be able to process 985, 500 tons of waste annually at a cost of $111 per ton if it operates all year round with 90 percent availability, (Citizen Budget Commission, 2012). This would save the City $59 for every ton sent to the new plant instead of being transported to landfill (Citizen Budget Commission,2016). Using this estimate, taxpayers would save approximately $119 million if the city diverts two million tons from landfill to WTE plant in 2022 (Citizen Budget Commission, 2012). This would lead to a reduction in the cost for disposing MSW in the City from $526 million to $408 million, a 23 percent drop in 2022 (Citizen Budget Commission, 2012). The diversion of two million tons of waste from landfills to WTE would not only save the city money but also reduce greenhouse gas emission (Citizen Budget Commission, 2012). Greenhouse gas emission due to this diversion is expected to decrease by 35 percent, which is equivalent to the reduction of carbon dioxide from 679,000 to 439,000 metric tons (Citizen Budget Commission, 2012).
A Full detail on recommendations for the city regarding WTE can be found in section 4.4. of this report
4.1.7. Conclusion
The use of WTE facilities has proven to be one of the best ways of managing MSW. WTE helps lower greenhouse gases and provides energy and material recovery. WTE also help reduce our reliance on fossil fuels for electricity, which leads to the reduction of greenhouse gas. WTE would also help increase the recycling rate of the city. Building WTE plant within NYC might be a problem due to the misconceptions surrounding WTE facilities. When people hear WTE, they think back to the old incinerators that were used in the 20th century in NYC. Therefore, it is essential for New York City to develop programs that would educate New Yorkers about the benefit of having WTE in the city and the differences between modern incinerators and the incinerators from 20th century. WTE has more benefits for the city than any effect it might have on the environment.
References
An, J., Kim, J., Golestani, B., Tasneem, K. M., Al Muhit, B. A., Nam, B. H., & Behzadan, A. H. (2014). Evaluating the use of waste-to-energy bottom ash as road construction materials. University of Central Florida: Department of Civil, Environmental, and Construction Engineering. Accessed: December 8, 2016: http://www.fdot.gov/research/completed_proj/summary_smo/fdot-bdk78-977-20-rpt.pdf
Bernstein, F.A. (2004). Beauty in Garbage: Naka Incinerator Plant by Yoshio Taniguchi. Arch News Now. Accessed November 26. 2016: http://www.archnewsnow.com/features/Feature152.htm
Chambers, T (2016). Interviewed by me. Facility manager of Covanta Huntington LP. Kings Park, NY.
Citizens Budget Commission (2012). Taxes In, Garbage Out: The Need for Better Solid Waste Disposal Policies in New York City. Citizens Budget Commission New York. Accessed October 6, 2016: http://www.cbcny.org/sites/default/files/REPORT_SolidWaste_053312012.pdf
Cohen, C., Martinez, H., and Schroder, A. (2015). Waste Management Practices in New York City, Hong Kong and Beijing. Columbia University. Accessed October 5, 2016: http://www.columbia.edu/~sc32/documents/ALEP%20Waste%20Managent%20FINAL.pdf
Dunlap, D.W. (1989). Panel Votes Bill to Ban Incinerators. New York Times. Accessed November 28, 2016: http://www.nytimes.com/1989/05/23/nyregion/panel-votes-bill-to-ban-incinerators.html
EIA (2016). Energy in Brief: How much U.S. electricity is generated from renewable energy. Energy Information Administration. Accessed December 6, 2016: https://www.eia.gov/energy_in_brief/article/renewable_electricity.cfm
EPA (2016). Energy Recovery from Waste: Air Emissions from MSW Combustion Facilities. Environmental Protection Agency. Accessed December 8, 2016: https://archive.epa.gov/epawaste/nonhaz/municipal/web/html/airem.html
Harden, B. (2008). Japan Stanches Stench of Mass Incinerators. Washington Post. Accessed November 28, 2016: http://www.washingtonpost.com/wpdyn/content/article/2008/11/17/AR2008111702968.html
Lam, C. H., Ip, A. W., Barford, J. P., and McKay, G. (2010). Use of incineration MSW ash: a review. Sustainability, 2(7), 1943-1968.
Pérez-Villarejo, L., Eliche-Quesada, D., Iglesias-Godino, F. J., Martínez-García, C., & Corpas-Iglesias, F. A. (2012). Recycling of ash from biomass incinerator in clay matrix to produce ceramic bricks. Journal of environmental management, 95, S349-S354.
Psomopoulos, C. S., Bourka, A., & Themelis, N. J. (2009). Waste-to-energy: A review of the status and benefits in USA. Waste management, 29(5), 1718-1724.
Rizzo, C., & Plum, M.K. (2012). Waste-to -Energy Facilities in New York City: Challenges and Opportunities. Accessed October 2, 2016: http://www.clm.com/publication.cfm?ID=370
Sylvan, D. (2011). Municipal Solid Waste in New York City: An Economic and Environmental Analysis of Disposal Options. New York League of Conservation Voters Education Fund (NYLCVEF). Accessed October 6, 2016: http://nylcvef.org/wp-content/uploads/2013/07/Solid-Waste-Background-Paper.pdf
Szendro, B. (2015). New York City Makes Small Improvement in Recycling Rate: Despite improvements, Department of Sanitation falls short of its goal. New York League of Conservation Voters (NYLCV). Accessed November 15, 2016: http://nylcv.org/news/new-york-city-makes-small-improvement-in-recycling-rates
Walsh, D. C., Chillrud, S. N., Simpson, H. J., & Bopp, R. F. (2001). Refuse incinerator particulate emissions and combustion residues for New York City during the 20th century. Environmental science & technology, 35(12), 2441-2447
Walsh, D. C. (2002). Peer Reviewed: The Evolution of Refuse Incineration. Environmental science & technology, 36(15), 316A-322A.
WastedNYC (2015). History of Incineration in New York City. WastedNYC. Accessed November 28, 2016: https://wastednyc.wordpress.com/local-incineration/incinerators-in-inwood/
Cite This Work
To export a reference to this article please select a referencing stye below:
Related Services
View all


DMCA / Removal Request
If you are the original writer of this essay and no longer wish to have your work published on UKEssays.com then please click the following link to email our support team:
Request essay removal