Causes of Parturition in Cattle
| ✅ Paper Type: Free Essay | ✅ Subject: Sciences |
| ✅ Wordcount: 3213 words | ✅ Published: 12 Sep 2017 |
Parturition in cattle is known to be a complicated physiological process, where the onset is generally accepted to be initiated by the fetus (Thorburn et al., 1977; Thorburn, 1979). In normal circumstances, this complicated process involving several hormonal interactions and should conclude without any human interference, leaving a healthy cow with a vigorous calf. However, in reality a large proportion of calving require assistance to varying degrees that may result in a stillborn calf (Meijering, 1984). Domestication and breeding programmes in the dairy industry select for cows that produce calves that are relatively larger when compared to their dams; a regular occurrence in cattle compared to most other mammals (McClintock, 2004).
As dystocia is highly related to the pelvic area (Price and Wiltbank, 1978), being able to measure the pelvic dimensions is beneficial. The process of measuring the internal and external capacity and diameter of the pelvis is known as pelvimetry (Studdert et al., 2011). This is elucidated in studies which reveal that there is value in using external pelvimetry as a predictor for the internal pelvic measurements (Murray et al., 2002), while others show that withers height and heart girth were the best predictors of internal pelvic sizes (Kolkman et al., 2012; Coopman et al., 2003). Hence, it would be easier if the farmer had an alternate method to measure internal pelvic dimensions, such as predicting those dimensions through measurements of external morphometry which could be done directly using measuring tape. Therefore, the ability to accurately determine the possibility of dystocia will allow early and appropriate intervention, which then decreases the morbidity and mortality of the dam and fetus, improving animal welfare and reducing economic losses (Linden et al., 2009).
There is a need for information regarding associations between internal pelvic measurements and external morphometry, which may have value in determining dams with larger pelvic opening that increases calving ease (Bellows et al., 1971). Currently, no research has been done to study the association between the intrapelvic measurements and the external morphometric measurements in Friesian cross cattle in Malaysia. Hence, the objective of this study was to determine the relationship between intrapelvic area, morphometric measurements, age, body weight and body condition score in Friesian cross cattle which could be of value in determining dams with larger pelvic openings and thereby reducing the risk of dystocia. It is hypothesized that there is an association between the intrapelvic measurements and external morphometry in Friesian cross cattle.
Dystocia, defined as delayed or difficult parturition (Mushtaq, 2016), is usually classified into two main causes which are direct factors and indirect factors (Meijering, 1984). The former usually being anatomical and physiological factors such as malpresentation of the calf in the birth canal and uterine torsion in the dam. The latter is related to phenotypic effects that are related to the calf such as calf birth weight, multiple calvings and perinatal mortality, as well as, phenotypic effects associated with the cow such as cow pelvic area, cow body weight at calving, cow body condition score, gestation length and calving assistance. Indirect factors also include non-genetic factors such as cow age, parity of cow, calf sex, nutrition and other disorders, while genetic factors involve cow, bull and calf breeds (Zaborski et al., 2009). The most common cause of dystocia is a physical incompatibility between the size of the foetus and maternal pelvic size, also known as feto-pelvic incompatibility. The pelvic size of the dam is mainly influenced by the stage of maturity of the cow. As a result, a smaller size of the pelvis contributes to the higher incidence of dystocia in heifers (Haskell and Barrier, 2014) and vice versa where dams with larger pelvic openings experience less calving difficulty (Barrier et al., 2013).
Several studies have shown that there are significant differences in pelvic dimensions between breeds of beef and dairy cattle (Ramin et al., 1995; Laster 1974; Meijering and Pastma, 1984; McElhenney et al., 1985). There are also differences between herds within breeds, purebreds and crossbreeds, and small breeds and large breeds. The pelvic height and pelvic width increase greatly with advancing age, which shows that the pelvic area is larger in mature cows in comparison to heifers. The mean pelvic heights in beef and dairy heifers can vary from 13.5 cm to 19.3 cm, the pelvic width from 12.6 cm to 18 cm, and the mean pelvic area from 170 cm2 to 290 cm2.
The occurrence of dystocia has shown to have an adverse effect on the reproductive performance of dairy cows, where the first oestrus, days open and the calving interval were significantly longer (Gaafar et al., 2010). Fertility is further impaired as a result of dystocia as it causes a reduction in conception rate and an increase in the number of services per conception (Lopez de Maturana et al., 2007). Total milk yield also tends to be lower in cows that have experienced dystocia at calving compared to those that calved normally (Berry et al., 2007). Furthermore, there is a significant increase in the mortality rate of cows experiencing dystocia in comparison to those that calved without assistance and the number is highest in cows that require serious intervention during parturition (Dematawewa and Berger, 1997).

2.4 Impact of Dystocia on Calf
Majority of stillbirths were reported to be a direct result of dystocia (Meyer et al., 2000; Lombard et al., 2007). During parturition, there are several dramatic physiological changes that can have adverse effects on the foetal oxygen concentration (Lombard and Garry, 2013). The foetus can experience neonatal asphyxia during the calving process due to hypoxia, decreased blood flow as a result of occlusions of the placenta, or ischaemia. Hypoxia can progress to anoxia, which can be prolonged with instances of dystocia resulting in foetal death (Bluel et al., 2008). The calf can also have hypercapnia, which can cause respiratory acidosis. However, during dystocia the respiratory acidosis will be pronounced and in addition to this, the hypoxia can lead to anaerobic metabolism within the body that results in metabolic acidosis. The acidotic condition of the foetus can negatively affect the central nervous system resulting in lowered vigour, depression and decreased physical activity, which is referred to as ‘weak calf syndrome’ or ‘dummy calf syndrome’ (Ravary-Plumioën, 2009). The dystocic calves were slower to express most of the neonatal behaviours, particularly those that lead up to reaching the udder, and usually lay recumbent (Barrier et al., 2012). This results in the failure of transfer of passive immunity as the calf is unable to absorb an adequate quantity of colostrum (Johnson et al., 2007; Weaver et al., 2000). This has been linked with an increase in calf morbidity and mortality and a reduction in the calf growth rate (Robison et al., 1988; Donovan et al., 1998).
In a United Kingdom dairy herd, the total cost of a slightly difficult calving was estimated to be roughly £110, while a more serious difficult calving can range from £350 to £400. This takes into account the labour and veterinary costs, including the cost of caesarean deliveries, the mortality of dams and calves and the culled cows, the losses incurred due to a decreased milk production and poor reproductive performance (McGuirk et al., 2007). In Australian Friesian Holstein herds, the cost of dystocia for a herd can go up to $5100 per year, where 30% of the losses is due to reduced fertility, 20% due to culling or dam death, veterinary costs were about 10% and labour costs were 20%. The cost of dystocia in primiparous cows was about $48.49, while it was $19.15 in mature cows. The overall losses associated with calving difficulties in the Australian dairy industry can be estimated to be in excess of $44 million annually (McClintook, 2004). In a study by Dematewewa & Berger (1997), the estimated costs of dystocia were $0.00, $50.45, $96.48, $159.82 and $379.61 for dystocia scores 1 to 5 (1 representing no problem to 5 representing extreme difficulty). which showed that losses incurred increase as the difficulty of calving increases.
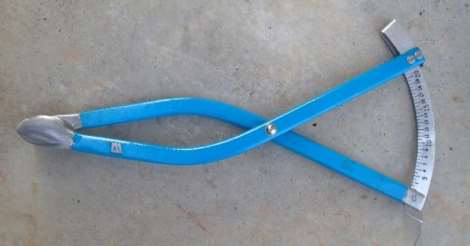
Internal pelvimetry involves the measurement of the pelvic height and the pelvic width, which allows the pelvic area to be determined (Rice and Wiltbank, 1972; Bellows et al., 1971; Morrison et al., 1986; Johnson et al., 1988). The internal dimensions are measured using a sliding calliper device that is referred to as a Rice pelvimeter. Other instruments have also been developed such as the Krautmann-Litton Bovine pelvic meter and the EquiBov Bovine pelvimeter (Deutscher, 1987). The external pelvimetry is mostly done in correlation to the internal pelvic dimensions where the measurements are taken on the external body of the animal; for example, the pin width, hook width, rump length and hook to pin length (Bellows et al., 1971; Johnson et al., 1988; Coopman et al., 2003). Pelvimetry is a relatively simple and reliable method to determine pelvic parameters of cows with the basis that the larger the pelvic area, the lower the calving difficulty. However, a farmer would require the services of a veterinarian with the skills and knowledge to peform this technique, which would increase costs to the farm (Kolkman et al., 2012).
The measurement of internal pelvic parameters is invasive and carries a risk of trauma to the rectal mucosa. It has been recommended to administer epidural anaesthesia which allows the cow to stand normally without arching her back or attempting to strain. However, the administration of the epidural anaesthesia requires specialised veterinary training (Murray et al., 2002). Despite the risk for injury, if the internal pelvimetry is done properly and gently with the use of adequate quantities of lubrication, damage to the rectal mucosa can be prevented (Hiew and Constable, 2015).
3.0 Materials and Methods
Data was collected from 50 Friesian cross dairy cattle (23 from Ladang 16, Taman Pertanian Universiti (TPU), Universiti Putra Malaysia (UPM) and 27 others from two dairy cattle farms in Bangi, Selangor and Lenggeng, Negeri Sembilan that were part of the Ladang Angkat Programme) within a period of 2 weeks using convenience sampling. All of the cows were between 2-14 years of age and weighed between 200-750 kg. The ages of the cows at TPU were taken from recrodsm, whereas the ages of the other cattle were determined using dentition (Lawrence et al., 2001). This study was approved by the Institutional Animal Care and Use Committee (IACUC), with the reference number: UPM/IACUC/FYP.2016/FPV.71
The external morphometry that was measured was the thoracic circumference, abdominal circumference, hook width and pin width. Thoracic circumference (Figure 1) was determined using a measuring tape (tailor fibreglass measuring tape) placed immediately caudal to the scapula and forelimbs. The abdominal circumference (Figure 2) was determined by placing the same tape tape cranial to the hind limbs, tuber coxae and udder, and was measured in centimetres (West, 1997) (Figure 3). The hook width (Figure 4) was measured using the linear distance between the most lateral surfaces of the wings of the ileum or tuber coxae. The pin width (Figure 5) is the linear distance between the most lateral surfaces of the tuber ischium (Singh et al., 1984) (Figure 6). These distances were measured in centimetres using straight rulers and a tape measure whereby one straight metal ruler was placed vertically at the lateral aspect of the tuber coxarum or tuber ischium and the other straight metal ruler was placed vertically at the lateral aspect of the opposite tuberosity with the measuring tape stretched tautly between the two rulers (Craig, 1941). The body condition score was measured using a 5-point scoring method with quarter-point increments from an established scoring system from Elanco Animal Health (1997). The body weight was determined by measuring the thoracic circumference using a calibrated heart girth tape[MH1], in kilograms.
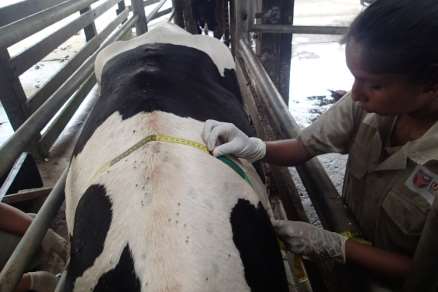

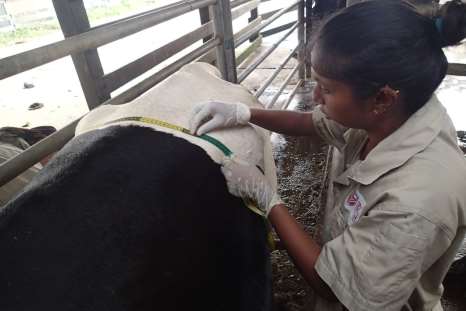


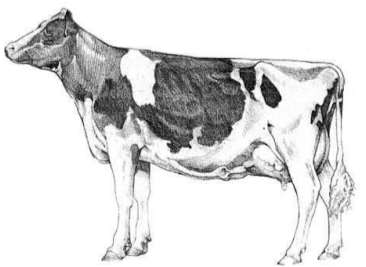
Figure 3: External morphometry; a. Thoracic circumference, b. Abdominal circumference (Elanco Animal Health, 1997)
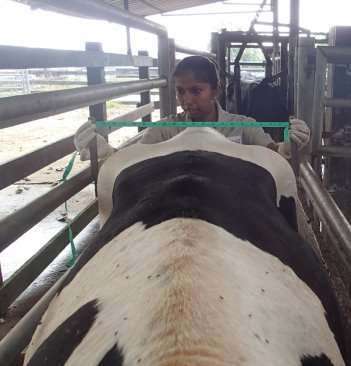
Figure 4: Measuring the distance between the tuber coxae
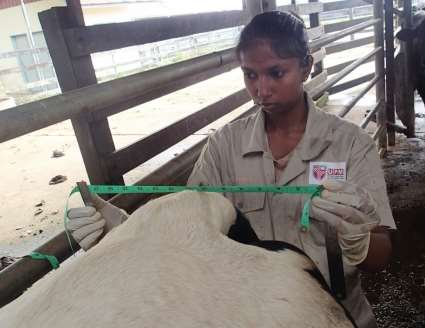
Figure 5: measuring the distance between the tuber ischii


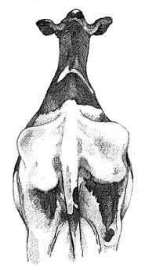
Figure 6: External morphometry; a. The distance between tuber coxae, b. The distance between tuber ischii (Elanco Animal Health, 1997)
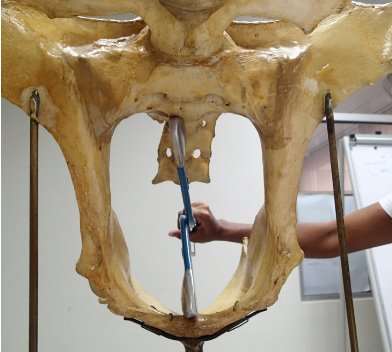
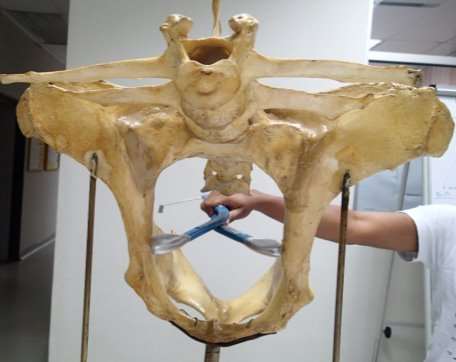
The internal pelvimetry was measured using a Rice pelvimeter (Lane Manufacturing Inc., Colorado, U.S.A.) (Figure 3) that provides measurements in centimetres with a gradient of 0.25 cm. Faeces were manually evacuated from the rectum and the pelvimeter was well lubricated using an aqueous based lubricant (BOVIVET Gel granulate). The closed pelvimeter was gently and slowly introduced into the rectum in a closed position by the hand, with the arm of the investigator protected using a disposable rectal sleeve (KRUTEX super sensitive disposable examination gloves) The pelvic height (Figure 4) was measured by opening the device within the pelvic canal and recording the distance between the dorsal aspect of the pubic symphysis on the floor of the pelvis and the ventral aspect of the sacral vertebrae. The pelvimeter was then closed and rotated 90° to measure the pelvic width, (Figure 5) which is defined as the horizontal distance at the widest point between the left and right ileal shafts at right angle to where the height was measured (Bellows et al., 1971). One limitation of the Rice pelvimeter is that it has a maximum reading of 20 cm, but in this study none of the cows had pelvic measurements that exceeded 20 cm. The intrapelvic area was calculated as the area of a rectangle by multiplying the pelvic width and the pelvic height (Gaines et al., 1993; Ramin et al., 1995; Green et al., 1988). The intrapelvic area can also be measured as an ellipse with the equation PA = PH Ã- PW Ã- Ï€/4 (David, 1960). Despite the higher degree of accuracy offered by the ellipsoidal equation, the rectangle equation was used for calculation because the ellipsoidal equation offered no advantage of predicting the risk of dystocia and did not differ when ranking pelvic size (Rice and Wiltbank, 1972).


All measurements taken were measured three times consecutively by the same person and the resulting mean values were used for analyses.
Data was placed on a data capture sheet for each farm, and transferred to an Excel spread sheet (Microsoft Office Excel, 2016). The data was then analysed using IBM SPSS Statistics version 22. Data was expressed as mean ± standard deviation. Shapiro-Wilk test was used as a numerical means of assessing normality, and the output of a normal Q-Q plot was used to determine this graphically. A one-way analysis of variance (ANOVA) was conducted to examine the relationship of age categories (2 – 3 years, 3 – 4 years, 4 – 5 years, 5 – 6 years and > 6 years) on the external morphometry and internal pelvic measurements. Pearson product-moment correlation coefficient (r) was used to determine the association between internal pelvic dimensions and external morphometry, age, body weight and body condition score. Regression analysis was performed to determine the ability of external morphometry, age, body weight and body condition score to predict internal pelvic dimensions. The data collected were used to develop multiple regression equations that estimate the inner pelvic sizes from the external measurements.
The descriptive statistics for age, body weight, body condition score, external morphometry and internal pelvic measurements for the 50 Friesian cross cows are given in Table 1.
Table 1: Age, body condition score, body weight, external morphometry and internal pelvic measurements for 50 Friesian cross cattle.
|
Trait |
Minimum |
Maximum |
Mean |
S.E. |
S.D. |
Median |
|
Age (months) |
24.00 |
165.00 |
60.16 |
4.17 |
29.16 |
54.00 |
|
Body condition score (1-5) |
2.50 |
4.00 |
3.21 |
0.05 |
0.36 |
3.25 |
|
Body weight (kg) |
277.3 |
722.7 |
456.9 |
14.0 |
98.7 |
437.8 |
|
Thoracic circumference (cm) |
151.5 |
206.2 |
177.0 |
1.8 |
12.4 |
175.9 |
|
Abdominal circumference (cm) |
152.0 |
227.8 |
189.2 |
2.2 |
15.8 |
189.4 |
|
Distance between tuber coxae (cm) |
38.3 |
57.2 |
47.5 |
0.6 |
4.4 |
47.7 |
|
Distance between tuber ischae (cm) |
20.0 |
45.6 |
31.5 |
0.8 |
5.7 |
31.8 |
|
Pelvic height (cm) |
12.42 |
19.50 |
16.64 |
0.22 |
1.59 |
17.13 |
|
Pelvic width (cm) |
11.67 |
19.08 |
15.64 |
0.24 |
1.69 |
15.50 |
|
Pelvic area (cm2) |
158.31 |
398.86 |
263.28 |
7.21 |
51.02 |
262.43 |
There was no significant difference between the mean pelvic area of the cows sampled and the minimum pelvic size of Friesian-Holsteins that was determined to have a low incidence of dystocia, where cows which had pelvic sizes greater than the determined value of 260 cm2 would have a reduced risk of dystocia (Hoffman et al., 1996). The mean pelvic size of the sampled cows was 3.28 cm2 larger than the determined value of 260 cm2. In this sample, 24 cows out of the 50 (48%) had pelvic areas below 260 cm2, with the smallest pelvic area being 158.31 cm2.
4.1 Analysis of variance (ANOVA)
The analysis of variance showed that there was a statistically significant difference between the age and: thoracic circumference (P = 0.008), abdominal circumference (P = 0.046), distance between tuber coxae (P = 0.046) and distance between tuber ischii (P = 0.009). However, there was no difference when it came to pelvic height, pelvic width and pelvic area (P > 0.05) amongst the age categories. The post-hoc comparisons using the Tukey HSD test gave indications that the means for thoracic circumference was lower for the age categories 2 – 3 years (170.1 ± 10.7 cm, P = 0.021), 3 – 4 years (172.4 ± 12.4 cm, P = 0.017) compared to the category > 6 years (189.4 ± 12.9 cm). There was a significant difference (P = 0.034) for abdominal circumference when comparing age category 4 – 5 years (180 ± 13.3 cm) to > 6 years (201.6 ± 15.3 cm).
4.2 Pearson’s Product-Moment Correlation
Table 2 illustrates the correlations between the external morphometry and internal pelvic dimensions, using Pearson’s Product-Moment Correlation. This reveals that the external morphometric parameters of thoracic circumference, abdominal circumference, distance between tuber coxae, and distance between tuber ischii have a moderately, positive correlation with the internal pelvic measurements of pelvic height, pelvic width and pelvic area that were statistically significant (P = 0.01). Age in months had a weak and positive correlation with pelvic height (r = 0.35) and pelvic area (r = 0.29) at the level of P = 0.05. However, there was no correlation between age and pelvic width (r = 0.25, P = 0.86).
Table 2: Correlations between the external morphometry and internal pelvic parameters.
|
Traits |
Pelvic Height |
Pelvic Width |
Pelvic Area |
||
|
Thoracic circumference |
0.50** |
0.53** |
0.48** |
||
|
Abdominal circumference |
0.60** |
0.52** |
0.52** |
||
|
Distance between tuber coxae |
0.46** |
0.49** |
0.43** |
||
|
Distance between tuber ischae |
0.47** |
0.54** |
0.50** |
||
|
** Correlation coefficient (r) is significant at the 0.01 level (2-tailed) |
|||||
Body weight (kg) showed a moderate positive correlation with pelvic height (r = 0.40), pelvic width (r = 0.50) and pelvic area (r = 0.44) at a level of P = 0.01. Body weight also displayed a very strong positive correlation with: thoracic circumference (r = 0.99), abdominal circumference (r = 0.76), distance between tuber coxae (r = 0.77) and the distance between tuber ischae (r = 0.73) at a level of P = 0.01. There were no correlations between the intrapelvic height (r = 0.11, P = 0.55), intrapelvic width (r = -0.10, P = 0.47) and intrapelvic area (r = -0.08, P = 0.60)and the body condition score (-0.104 .
There were positive correlations between age in months and thoracic circumference, abdominal circumference, distance between the tuber coxae and distance between tuber ischii, all of which are significant at the level of P = 0.01 (Table 3). There is also a significant correlation between age in months and the body weight (r = 0.58, P < 0.0005).
Table 3: Correlations between the age (months) and external morphometry in 50 Friesian cross cattle.
|
Age (months) with |
Correlation |
P-value |
|
Thoracic circumference |
0.56 |
< 0.0005 |
|
Abdominal circumference |
0.48 |
< 0.0005 |
|
Distance between tuber coxae |
0.45 |
< 0.0005 |
|
Distance between tuber ischae |
0.63 |
< 0.0005 |
The correlations between the external morphometry measurements are given in Table 4. There is significant, strong and positive correlation between each of the external morphometric measurements that were taken, where P < 0.0005 for all variables.
Table 4 Correlations between the external morphometry of 50 Friesian cross cattle.
|
Traits |
Thoracic circumference |
Abdominal circumference |
Distance between tuber coxae |
|
Thoracic circumference |
|||
|
Abdominal circumference |
0.76** |
||
|
Distance between tuber coxae |
0.78** |
0.72** |
|
|
Distance between tuber ischae |
0.72** |
0.64** |
0.77** |
|
** Correlation coefficient (r) is significant at the 0.01 level (2-tailed) |
|||
Several models were developed using linear and multiple regression analyses, which can be used to predict internal pelvic parameters using the external morphometric measurements that are given in Table 5. The best predictors for pelvic height would be body weight and the external parameters of thoracic circumference and abdominal circumference, where these parameters explain 58% of the variability of pelvic height. For pelvic width, the ideal predictor would be the distance between the tuber ischii which explains 29% of the variability of the pelvic width. Body weight, thoracic circumference and the distance between tuber ischii were the best predictors for pelvic area where they explain 40% of the variability of the pelvic area.
Table 5 Models to predict inner pelvic sizes from easily accessible external morphometry
|
Y |
Model |
R2 |
S.E. |
|
Pelvic Height |
Y = -50.57 – 0.06 Ã- BW + 0.47 Ã- Th + 0.05 Ã- Abd |
0.58 |
1.13 |
|
Y = -48.90 – 0.05 Ã- BW + 0.52 Ã- Th |
0.40 |
1.25 |
|
|
Y = 5.13 + 0.06 Ã- Abd |
0.37 |
1.38 |
|
|
Pelvic Width |
Y = 6.74 + 0.19 Ã- TcTc |
0.24 |
1.49 |
|
Y = 10.61 + 0.16 Ã- TiTi |
0.29 |
1.45 |
|
|
Pelvic Area |
Y = -1549.01 – 1.54 Ã- BW + 14.22 Ã- Th |
0.33 |
42.51 |
|
Y = – 1585.33 – 1.56 Ã- BW + 13.22 Ã- Th + 1.17 Ã- Abd |
0.39 |
41.15 |
Cite This Work
To export a reference to this article please select a referencing stye below:
Related Services
View all


DMCA / Removal Request
If you are the original writer of this essay and no longer wish to have your work published on UKEssays.com then please click the following link to email our support team:
Request essay removal